
Why are there so many articles on so-called zone 2 training, yet so little detailed advice on executing it?
If you have read a summary of an exercise science paper, you have experienced the knowledge gap between science and real-life practice. Most papers answer one question, only to generate two more.
Recently, 14 scientists and cycling coaches attempted to extend a small ladder across this gap. Specifically, they aimed to demonstrate how coaches put the science of zone 2 training (or “low-intensity training”) into practice in their work with high-level cyclists (1).
The result was a consensus paper thad addressed three critical questions:
- How do you define zone 2 training?
- What is your preferred method for implementing zone 2 training?
- What key physiological adaptations do you anticipate from zone 2 training?
The paper contains some practical gems you may consider for your next zone 2 sessions.
Before I discuss them in greater detail, you should know that I am one of the co-authors of this paper. So, I am not entirely impartial when reporting on it. At the end of this post, I’ll provide a link to the original paper so you can read it yourself.
Here is a brief overview of the scientists’ & coaches’ consensus.
Featured image: Radu Razvan / Shutterstock.com
What is zone 2 training?
Most coaches and scientists used a 5-zone system when prescribing aerobic training. Within this system, zone 2 was defined as just below lactate threshold 1 (LT1) / ventilatory threshold 1 (VT1).
Furthermore, this 5-zone system overlaps the 3-zone system you may have seen me refer to. Here, low- and moderate-intensity training are separated by LT1/VT1, whereas moderate- and high-intensity training are separated by LT2/VT2.
On a personal note, I like the 3-zone system for explaining the broad strokes of exercise intensity. However, for prescription of exercise intensity (and arguably, for tight control of training load), the 3-zone system may be somewhat coarse.
How does the 5-zone system translate to specific intensity targets for your rides? Let us start by discussing how to monitor your intensity.
How to monitor zone 2 exercise intensity?
The authors replied using several intensity markers in concert.
Most commonly, this involved a combination of heart rate, feel (RPE = rate of perceived exertion), and external load (power).
When you train at a given external workload, the toll that workload takes on your physiology depends on various factors, including training background, recovery status, hydration status, glycogen availability, and environmental conditions.
As a basic example, if I rode with Tadej Pogačar for an hour, and we both pedaled at 300 watts, we would both take on the same (external) training load. But the resulting strain on my body would be far greater than on his.
Adding a second (or third) internal load metric, like heart rate or RPE, in addition to power helps provide an extra layer of perspective on the cost of training.
When you practice this for a while, you will often achieve greater certainty in whether your internal load metric (HR, RPE) behaves “normally” or “abnormally” at your typical power output (in reference to your normal). In my experience, this is very useful in appropriately adjusting your training load and recovery.
What are specific zone 2 intensity ranges?
The coaches and scientists in this paper commonly prescribed zone 2 training at an intensity of 67 to 82% of maximal heart rate.
This equated to an RPE of 2-3 out of 10.
Of note, the heart rate at zone 2 was expected to be steady (no significant cardiac drift) for 1-3 hours. The original manuscript (linked towards the end) includes a table with preferred zone 2 ranges for HR, lactate, RPE, and power.
I understand your perspective if you’re surprised by the wide HR range (67-82% of HR max). However, this makes more sense when we consider the expected training adaptations from zone 2 work (details below).
It is also important to remember that this HR range only reflects where most of the athletes coached by these authors end up in their assumed zone 2. This does NOT mean that your zone 2 necessarily falls within this range. Recall that individuals differ significantly in how one intensity metric relates to another (2).
A simple way to gauge how your metrics behave is to consider all of the above considerations.
Example: Ride for 1-3 hours at an intensity that leaves no significant cardiac drift. Aim for an RPE 2-3. What is your resulting HR? Importantly, are you able to repeat this session over a long period, while still recovering sufficiently for your weekly interval session(s)?
What adaptations should you expect?
The authors frequently expected the following training adaptations:
- increased muscle capillarization
- increased mitochondrial enzymes in type I muscle fibers
- increased metabolic efficiency
- modest increases in critical power & VO2 max
In more practical terms, you would expect zone 2 training to bring your zone 2 power closer to your FTP. On that note, the experts provided another gem you should keep in mind:
Training adaptations are best seen as a continuum. You don’t suddenly turn one adaptation on and another one off when you move from one intensity zone to the next:
“Accordingly, they (coaches & scientists) did not expect large differences in the adaptations produced by the upper end of zone 1 and the lower end of zone 3, when compared with what they expected from zone 2.”
– Sitko et al. IJSSP 2025
As an example:
The authors suggested an intensity range for zone 1 of 55-72% of HR max and a zone 2 range of 67-82%. Notice the 5% overlap.
This begs the question: if you’re working at 70% of your HR max, are you doing zone 1 or 2 training?
You could argue that it doesn’t matter what you call it. And it probably doesn’t matter as much to your adaptation from a single session if you’re at 70%, 65%, or 75%. Just be aware that this intensity may impact the degree of fatigue you accumulate over time! (This is why we recommend you monitor your HR, RPE, in addition to power)
At this stage, some will probably say, “What about fat oxidation?” Surely, the degree of fat oxidation would be affected by the specific intensity you’re working at.
Personally, I agree that this is a valid question. But I would follow that up by questioning how well most cyclists know their fat max intensity (and how it behaves under varying circumstances and fuel availability situations).
To the best of my knowledge, these are not entirely straightforward relationships, even when you have performed metabolic testing. Even more so without extensive lab testing. With regards to fat oxidation, I question the value of obsessing over HR percentages if you don’t know precisely where your maximal fat oxidation occurs to begin with.
How to structure zone 2 workouts?
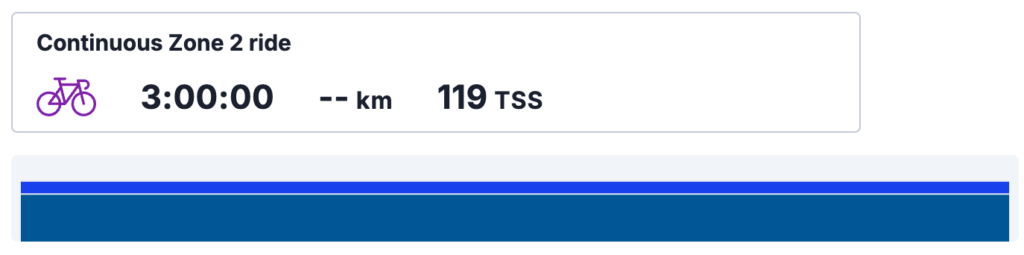
Three specific zone 2 workouts formats were particularly common among the authors:
- Continuous work (preferably > 2 hours)
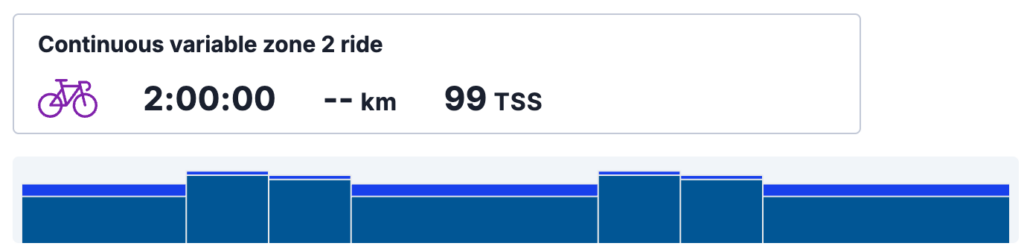
- Variable continuous work (tool to prevent boredom)
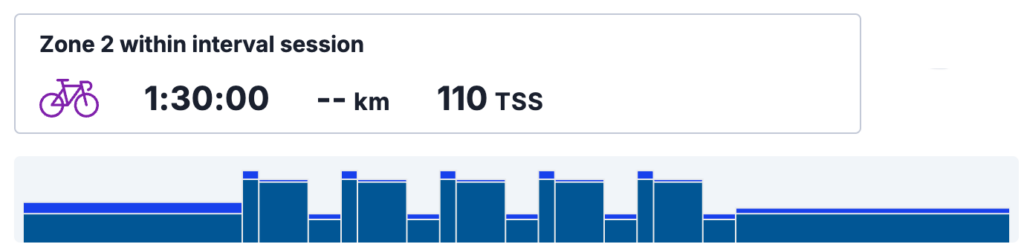
- Intervals (zone 2 work inserted before/after intervals)
Again, the details of each of these formats are explained in the original paper. Of note, pay attention to the following quote about continuous work (format 1):
“Given the length of these sessions, experts were in consensus regarding the importance of fatigue and its impact. Accordingly, the interplay between power output (or any external load metric) and both HR and RPE should be considered when adjusting the intensity of the late parts of each session.”
– Sitko et al. IJSSP 2025
If your heart rate or feeling of fatigue increases late in a ride, you may consider reducing your power to stay within your (HR, RPE) zone 2.
Summary
In summary, these 14 scientists and cycling coaches collectively practice zone 2 training with the following characteristics.
The top end of zone 2 is defined as LT1/VT1.
They use multiple intensity markers to monitor exercise intensity (more closely than what you would achieve with a single marker).
The prescribed intensity range is wide – intensity commonly ends up being prescribed at 67-82% of HR max, and RPE of 2-3 (out of 10).
Generally speaking, fatigue during later parts of workouts prompts a reduction in power output to stay within the (internal load) range of zone 2.
Finally, zone 2 training is executed as either continuous training, variable continuous work, or included in interval sessions.
As a final remark, take into consideration that this represents the “best practice” advice of these authors. As we discussed, there is a big gap of missing knowledge separating the hard science and all advice in the field. This gap can only ever be bridged by applying sound training principles, experience, common sense, and some careful trial & error.
Best of luck with your zone 2 training.
PS! Exitingly, a great paper on the interplay between different intensity markers with zone 2 training was also just published. I’ll provide a summary and some thoughts on it in the near future (2).
References:
- Sitko S et al. What is “zone 2 training”?: Experts’ viewpoint on definition, training methods, and expected adaptations. International Journal of sports Physiology and Performance. Ahead of Print. DOI: https://doi.org/10.1123/ijspp.2024-0303
- Meixner B et al. Zone 2 intensity: A critical comparison of individual variability in different submaximal exercise intensity boundaries. Translational Sports Medicine, 2025